
 ×
×
At a glance: A tympanogram measures how the eardrum moves when air pressure changes inside the ear canal, and the tracing falls into one of three main shapes. Type A is normal, Type B is a flat trace with no clear peak where interpretation depends on ear canal volume. Normal volume may indicate middle ear pathology such as effusion, large volume may indicate a tympanic membrane perforation or patent tympanostomy tube and very low volume may suggest probe or ear canal obstruction. Type C shows negative middle-ear pressure, which may be consistent with Eustachian tube dysfunction when interpreted with symptoms and other findings.
Tympanometry is a quick, painless procedure that gives clinicians objective data about middle ear function. Clinicians use tympanometry to assess middle-ear function and support the evaluation and monitoring of conditions such as middle-ear effusion alongside otoscopy, audiometry, patient history and other findings. The most common way to sort the results is Jerger’s classification, which groups tympanogram types into A, B, and C.
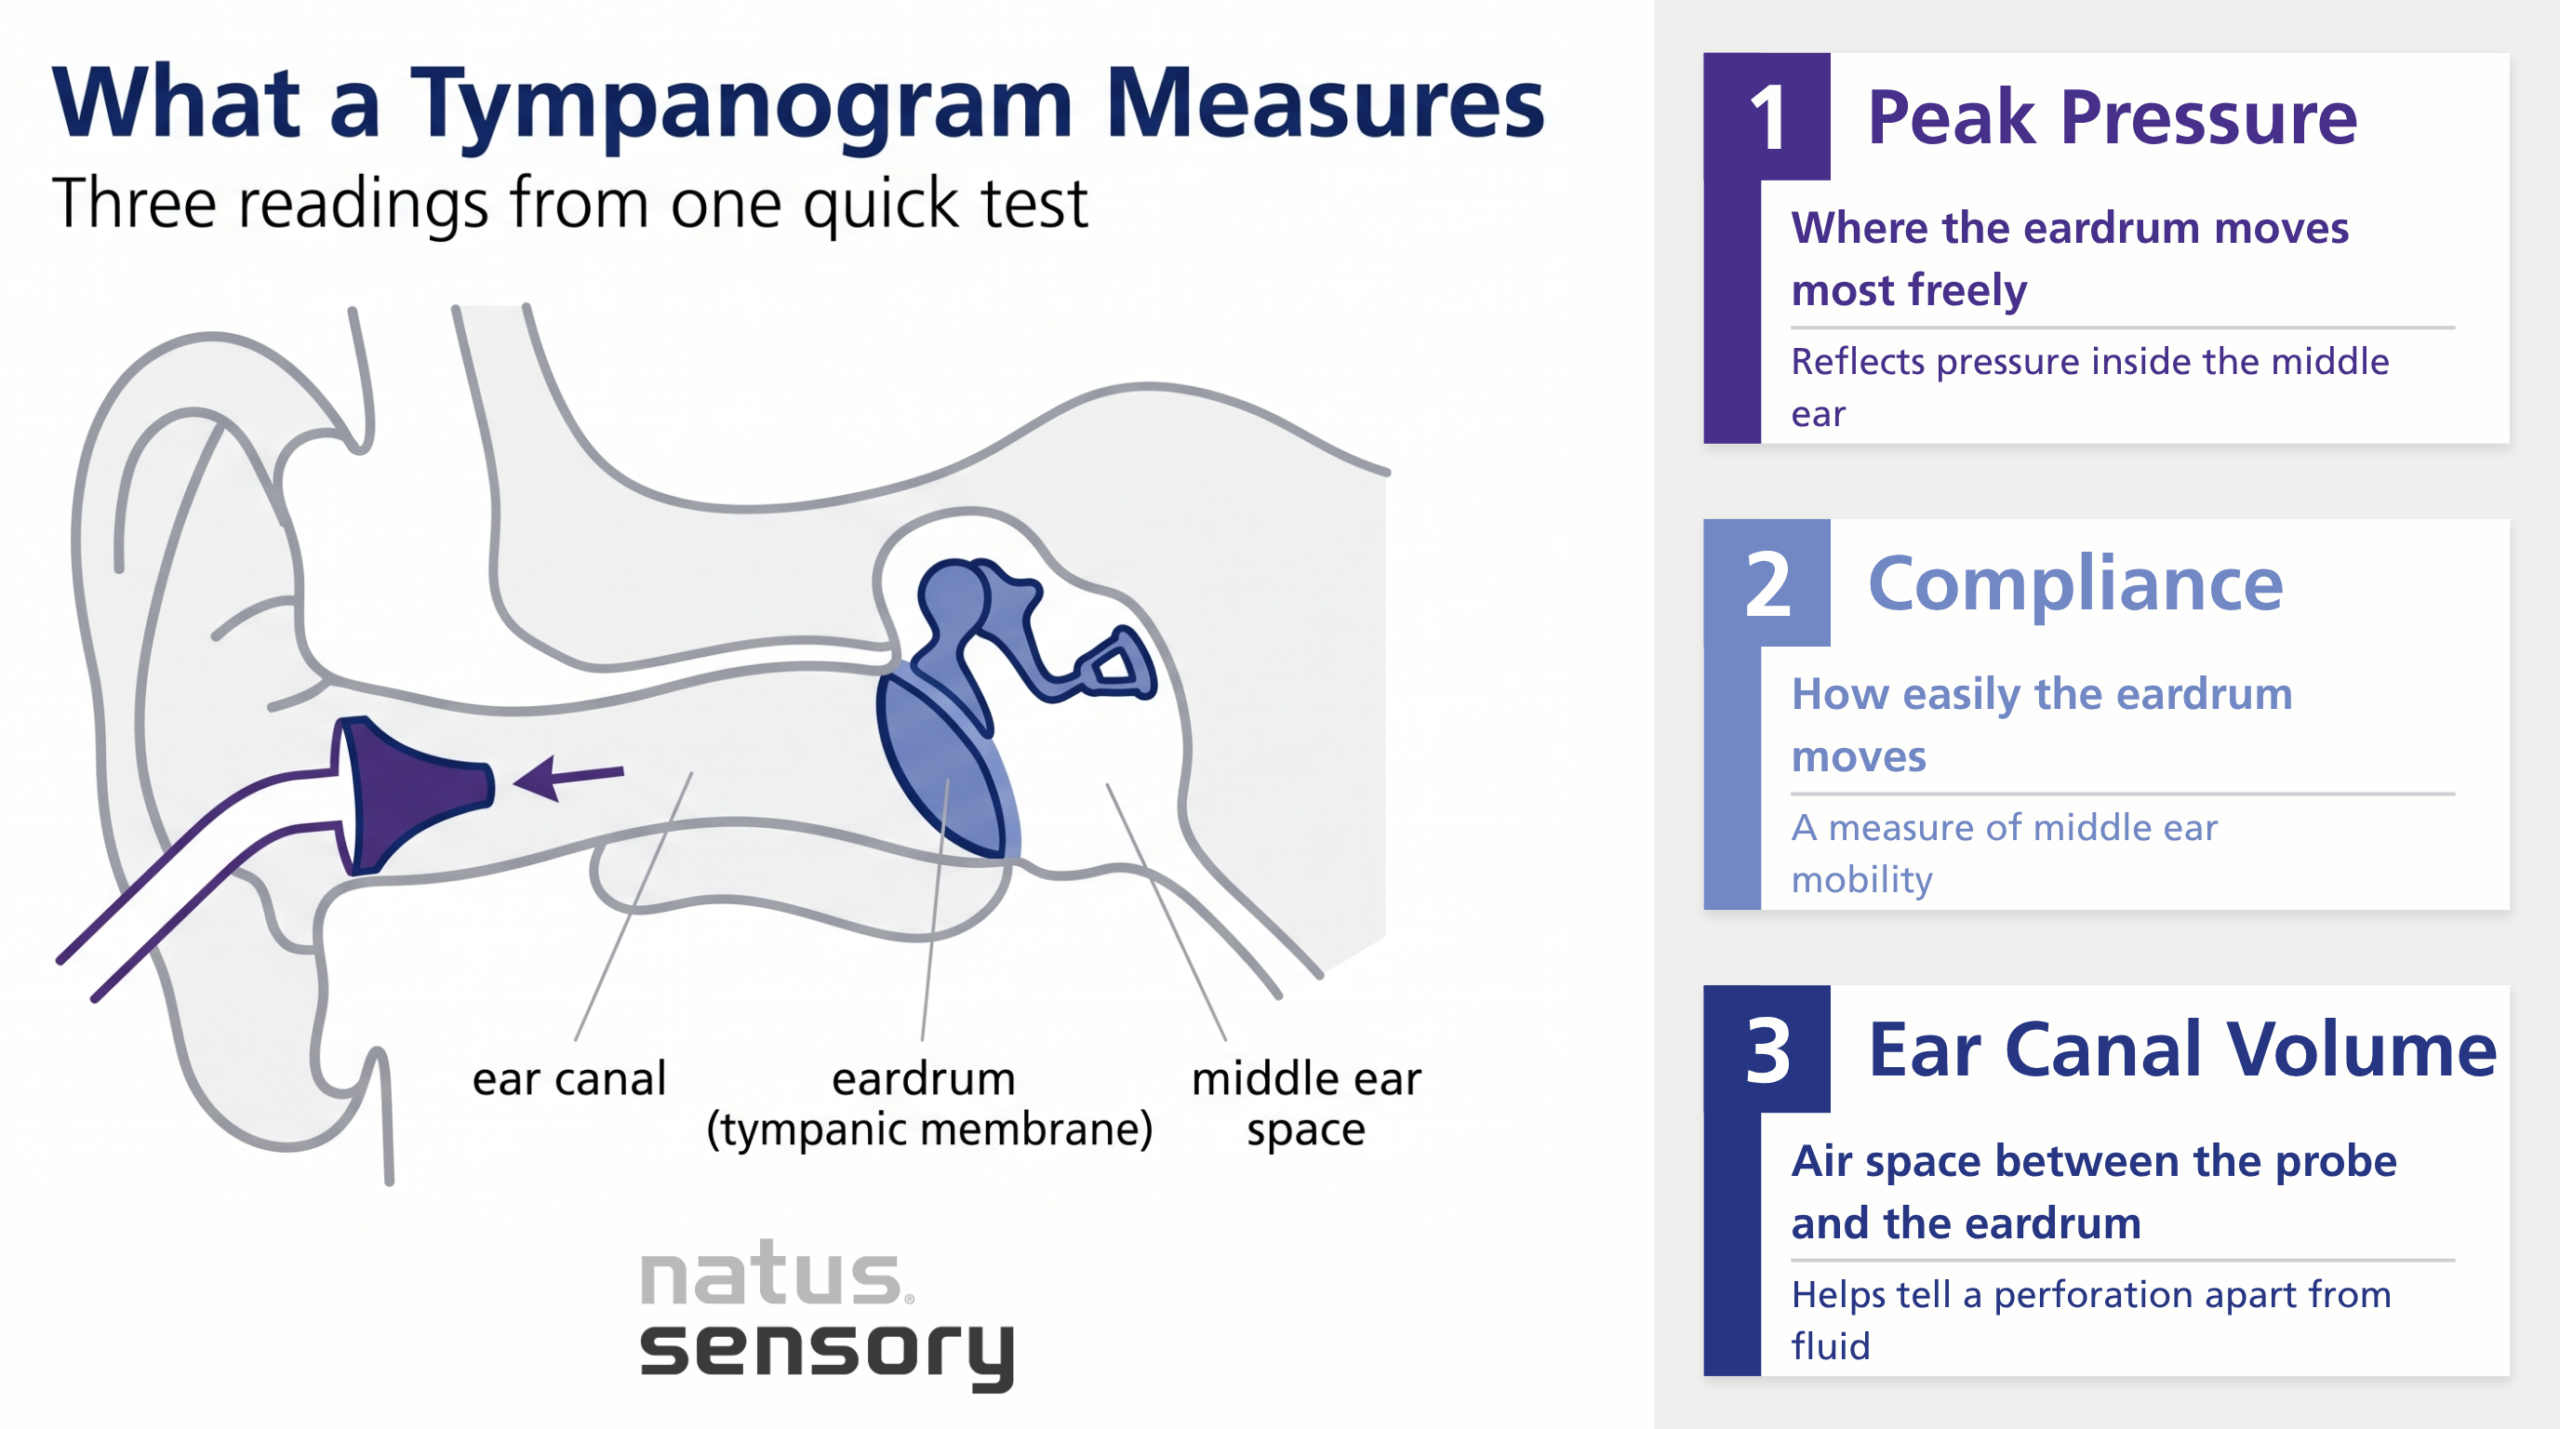
During a tympanometry test, a small probe forms an airtight seal in the ear canal. The probe sends a steady probe tone (usually 226 Hz) while a tiny pump changes the air pressure from positive to negative. The system measures how acoustic admittance changes as ear-canal pressure varies, producing a tympanogram that reflects the mechanical response of the tympanic membrane and middle ear. That eardrum movement is plotted as a curve called a tympanogram.
The test captures three readings that work together:
These tympanometry results give valuable insights, but they are read alongside patient history, symptoms, and other tests.
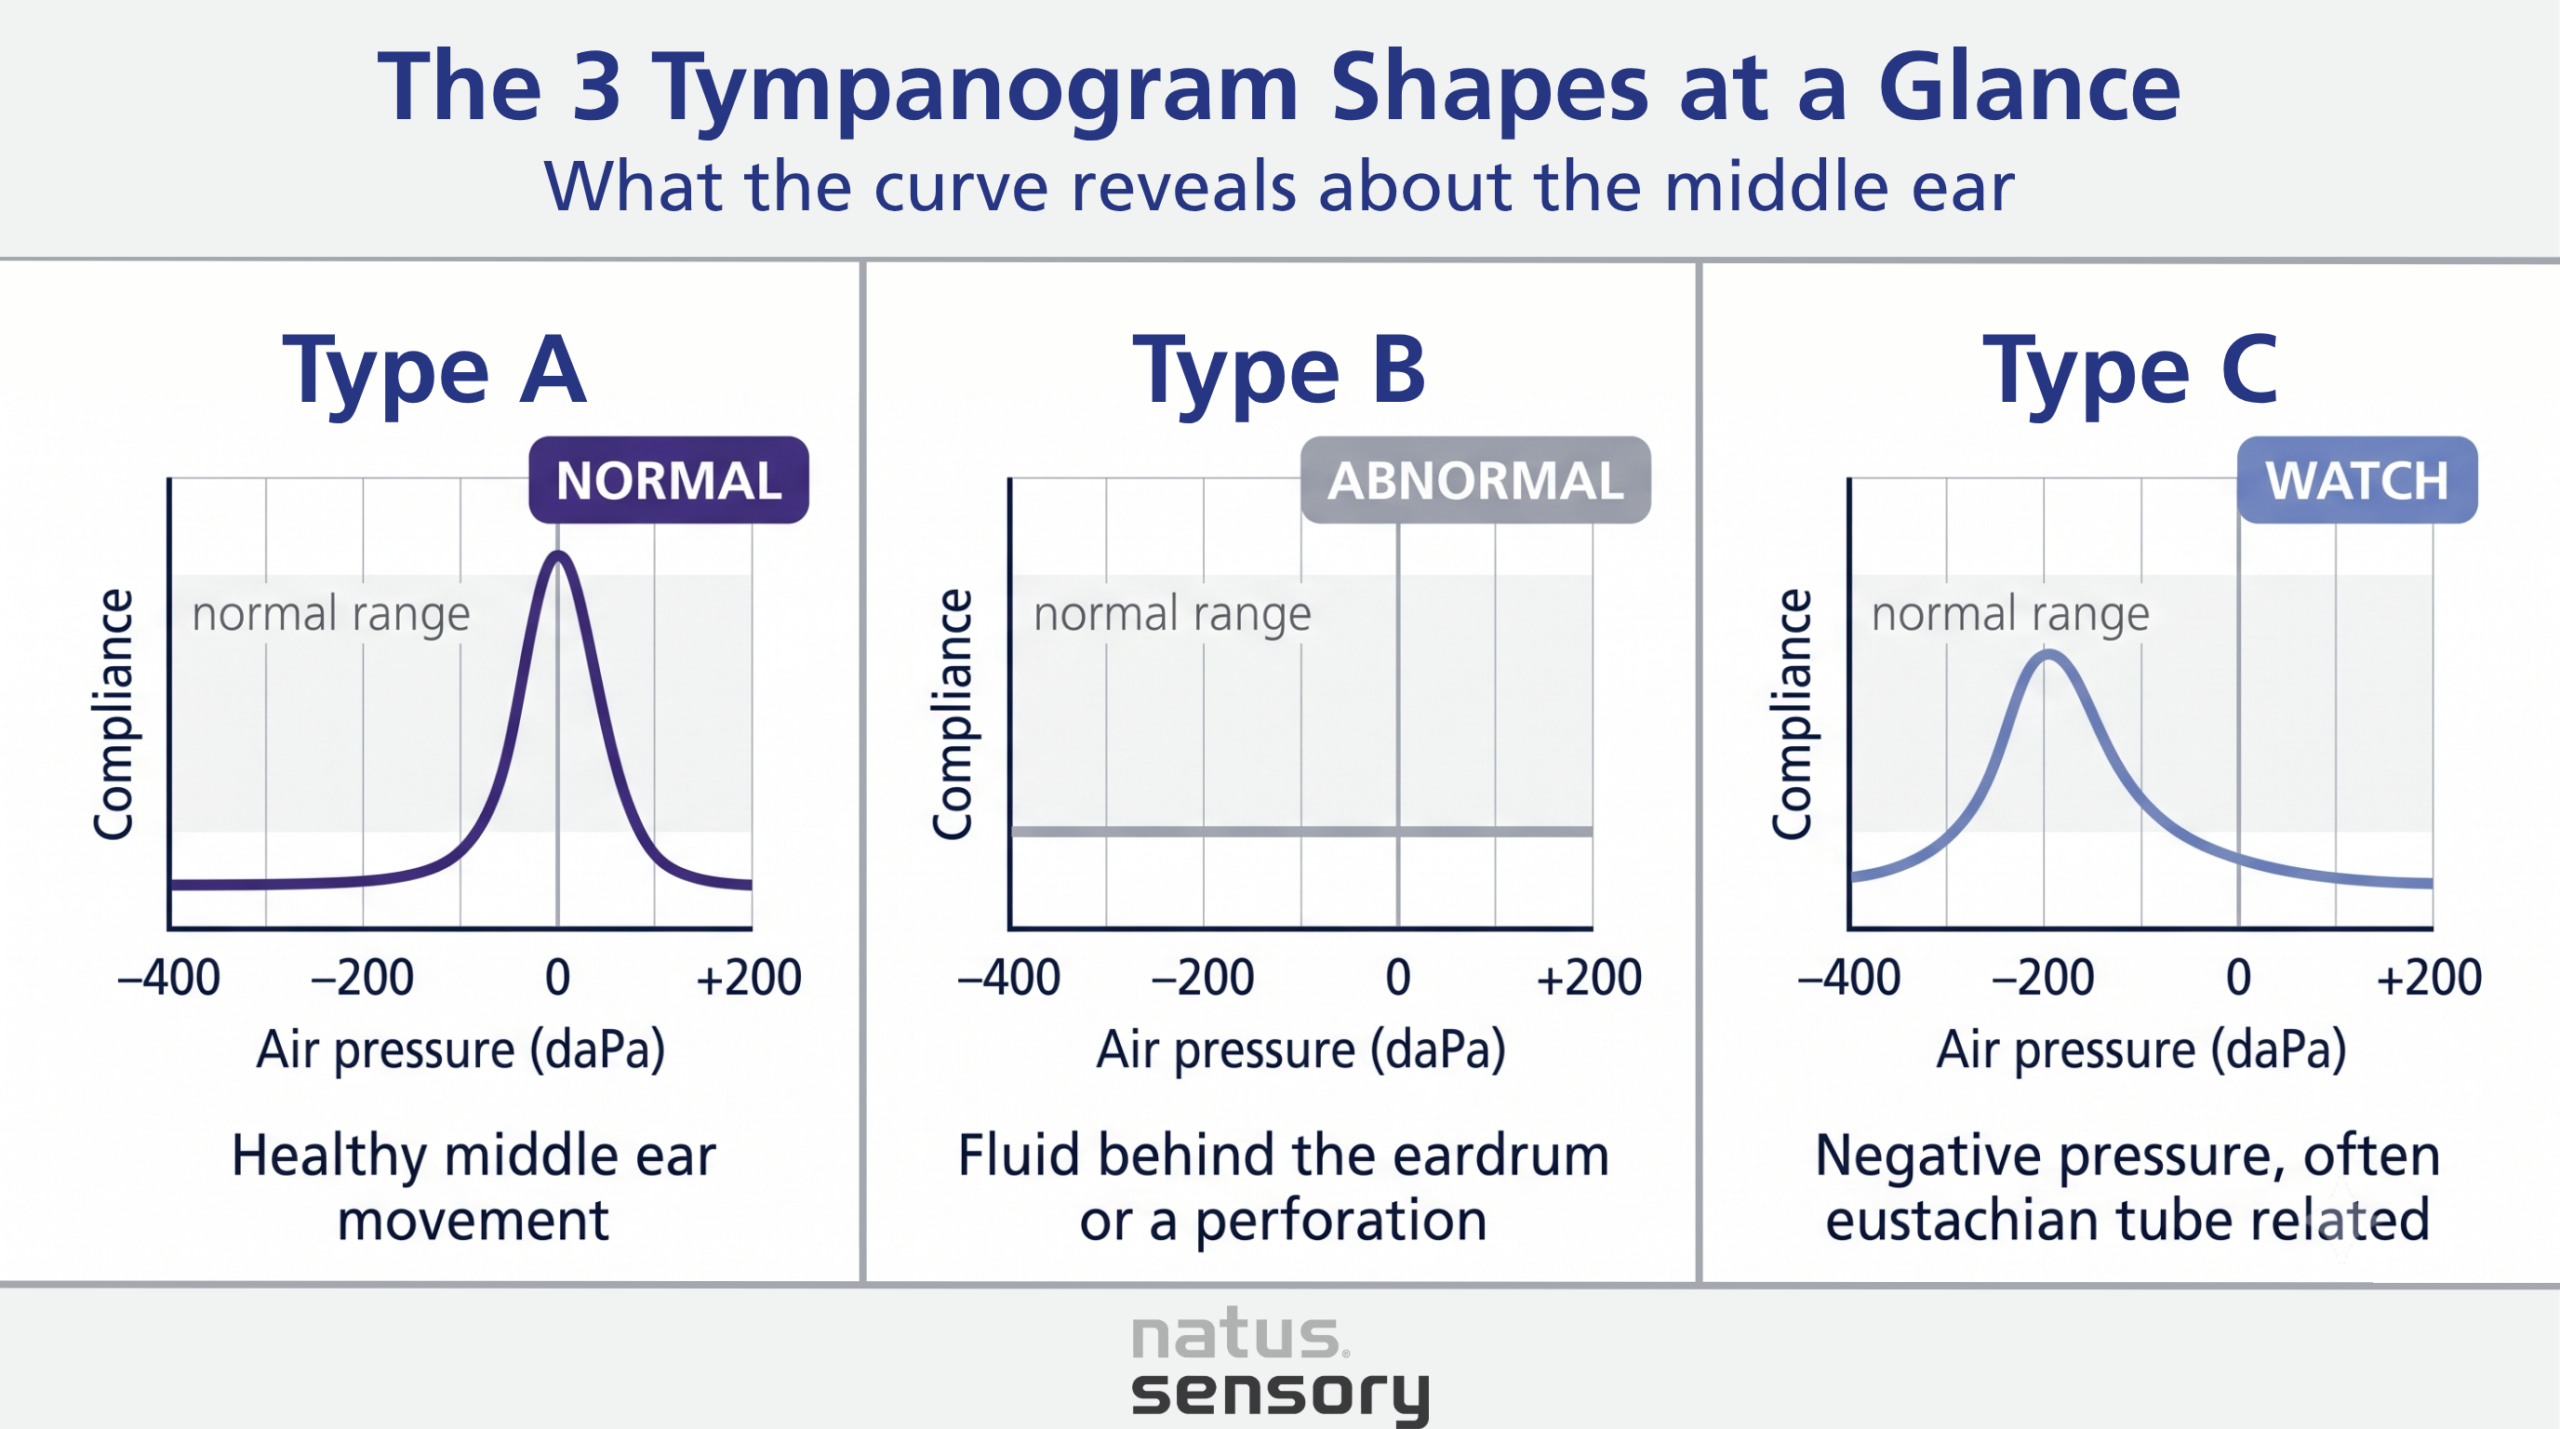
According to Jerger’s classification, most tympanograms fall into one of three patterns:
Newer variations exist for specific middle ear disorders, but these three remain the foundation of everyday tympanometry testing.
A Type A tympanogram has a peak within the applicable age- and equipment-specific reference range, generally near atmospheric pressure. The eardrum moves freely, sound passes efficiently through the middle ear system, and ear canal volume reads normal.
Two Type A variations are worth knowing:
A Type A result points to healthy middle ear function, but it does not rule out hearing loss from the inner ear.
A Type B tympanogram has no measurable peak. Its meaning depends strongly on equivalent ear canal volume. Several conditions and measurement factors can produce this pattern.
Middle ear effusion is the most common reason for a B tympanogram in children. By school age, most children have had at least one episode of middle ear fluid. One study of children undergoing myringotomy found that a flat Type B tracing with normal ear canal volume identified middle ear fluid with about 84% accuracy.
Because a flat line can mean either fluid or a perforated eardrum, clinicians often confirm the finding using ear canal volume, otoscopy or pneumatic otoscopy before choosing appropriate treatment.
A Type C tympanogram has a peak that shifts toward the negative side, which signals negative pressure in the middle ear. This is commonly associated with eustachian tube dysfunction, where the eustachian tube is not ventilating the middle ear effectively and air is absorbed from the middle ear space, creating negative pressure behind the tympanic membrane. Normally the eustachian tube equalizes the pressure between the middle ear and the nasopharynx.
Common triggers for a C tympanogram include:
Type C patterns may occur during or after upper-respiratory illness and may accompany evolving or resolving middle-ear dysfunction. Research shows a significant correlation between allergic rhinitis and middle ear problems. One study of young children reported a higher frequency of middle-ear effusion among children with allergic rhinitis, although prevalence varies by population and diagnostic criteria.
A tympanogram describes middle ear function, but it does not measure hearing on its own. Clinicians combine tympanometry with other assessments to build a more complete picture of hearing and ear health:
When test results stay abnormal or symptoms continue, a referral to an ENT specialist may be warranted for further assessment and management.
Standard tympanometry commonly uses a 226 Hz probe tone in adults and older children, while 1000 Hz tympanometry is generally preferred for neonates and young infants. Research points toward methods that read the middle ear across a much wider range of sound:
These tools are still reaching everyday practice, but they show where middle ear assessment is heading.
Size and weight shape where a tympanometer can go. The choice usually comes down to a handheld screening unit or a larger PC-based clinical system:
A handheld probe also helps with restless patients and young children, where a quick, secure seal on the first try supports accurate tympanometry results.

Reading tympanograms with confidence
Tympanometry is a fast, painless procedure that turns eardrum movement into clear tympanometry results. Type A points to normal middle ear function, Type B signals fluid buildup or a perforated eardrum, and Type C reflects negative pressure and eustachian tube dysfunction. Read alongside pure tone audiometry and a patient’s history, these patterns help clinicians assess middle-ear function and guide decisions about further evaluation when interpreted with otoscopy, hearing results and clinical history.
Accurate readings start with a tympanometer matched to your setting. The Madsen® Zodiac from Natus Sensory is a robust and reliable clinic-based immittance system that supports everything from screening through to advanced diagnostic immittance testing. For clinicians who need flexibility across multiple locations, the Bio-logic® AuDX PRO FLEX® is a lightweight, portable, battery-operated system offering screening and diagnostic tympanometry with optional OAE and audiometry modules. Madsen Zodiac integrates with Otosuite®, while AuDX PRO FLEX supports data management through BioLink software. Both are backed by global service and calibration support. To find the right fit for your workflow, explore our tympanometers or contact our team.
Sources:
054397 RevA